
Who Can’t Afford to Live in Santa Fe in 2022?
KELLY O’DONNELL, PH.D. | CHIEF RESEARCH AND POLICY OFFICER, HOMEWISE
Santa Fe has struggled for years with a shortage of affordable housing. The state capitol is a major employment center, with thousands of government jobs, and robust hospitality, arts, technology, and healthcare sectors that employ thousands more. (1) However, many people who work in Santa Fe simply can’t afford to live there. More than one-in-three people employed in Santa Fe commute from outside the county, often from homes in more affordable communities like Rio Rancho to the south and Espanola to the north. (2) Long car commutes contribute to climate change and impose high costs – financial, physical, and social – on workers and their families. People employed in Santa Fe who are unwilling or unable to live far from where they work have no choice but to absorb high housing costs that often leave few resources for other necessities like food and healthcare.
The New Mexico Mortgage Finance Authority estimates that 7,343 new rental units are needed to meet the demand for affordable housing in the Santa Fe area. (3) However, a July 2020 report by the University of New Mexico Bureau of Business and Economic research suggests that, when cost-burdened households and in-commuters are considered, the actual unmet need for affordable housing in Santa Fe is much higher and rapidly growing. (4) Framing the unmet need for housing as solely a deficit in affordable rentals also ignores the fact that many of Santa Fe County’s cost-burdened renter households could afford to purchase a reasonably-priced home, were such a home available to them. Moving more low- and moderate-income households into homes they own has the added advantage of increasing the supply of available rental housing.
Santa Fe’s severe and worsening housing shortage is evident in skyrocketing home sales prices, meager housing inventories, and rental vacancy rates that average 2.83 percent, but are below 1 percent for 3-bedroom apartments and less than one-half of one percent for 4-bedroom units. (5) Also striking is the degree to which growth in the cost of housing has outpaced wage growth.
In the twelve months between June 2020 and June 2021:
The average sales price for a single family home within the City of Santa Fe increased 30 percent. (6)
The average sales price on the City’s “affordable” south side increased 18 percent. (7)
The inventory of homes for sale decreased by over 50 percent. (8)
The housing affordability index, which measures whether a typical family has enough income to qualify for a mortgage loan on a typical home, declined a whopping 17 percentage points, from 66 percent to 49 percent – despite historically low mortgage interest rates. (9, 10)
The average rent for a 2-bedroom apartment in Santa Fe increased 7%.
The average hourly wage for Santa Fe workers increased 2.7%. (11)
Figure 1 depicts median sales prices for single family homes in Santa Fe and the average weekly wage received by Santa Fe workers.

Figure 1: Santa Fe Median Single Family Home Price and Average Weekly Wages
Source: Santa Fe Association of Realtors and Bureau of Labor Statistics Quarterly Census of Employment and Wages
The need for more affordable housing has received significant attention over the years. Recently, Santa Fe’s supply of rental housing has been bolstered by the addition of new market-rate apartments, but additions to the supply of affordable rentals have been modest and Santa Fe has not made meaningful additions to the supply of housing that moderate income households can afford to buy. Any addition to the housing stock is welcome because it has the potential to free up existing affordable units. However, even prior to COVID, planned additions to the county’s supply of affordable housing were inadequate to meet the need; and recent developments – including widespread job displacement due to COVID, rapid appreciation in home values, and inflation – threaten to swamp the modest progress underway, leaving Santa Fe’s moderate-income families with even fewer housing options than before.
The affordability crisis has serious implications for Santa Fe’s future. Vibrant communities and strong economies require a diversity of ages, races, and family types. Young families are critical to long-term economic growth because they provide the productive workforce that businesses need to grow and the tax base that communities need to thrive. Despite the rapid growth of neighboring states, New Mexico has experienced net out-migration of working-age people every year since 2012. Between 2010 and 2019, the state’s under-18 population shrank by over 8 percent, the working-age population declined 2 percent, and population of people over 65 grew 38 percent. (12) Santa Fe’s population exemplifies this trend. The county’s median age – 47.3 years – is 25 percent higher than that of New Mexico. Currently, 33 percent of county residents are over the age of 60. By 2050, that percentage is expected to climb to 43 percent, while people under 20 are expected to decline from 21 percent to 18 percent of county residents. (13) Eighty-five percent of Santa Fe’s cost burdened renters (those who must devote more than 30% of their income to housing) are working age adults, children, and youth. Without affordable housing, working-age people and families will become an ever-smaller share of Santa Fe’s population and the community’s economy and quality of life will suffer as a result.
Lack of affordable housing also contributes to intergenerational poverty, a problem throughout New Mexico and a drain on local economies. Santa Fe is one of New Mexico’s most affluent and most disparate counties. Santa Fe’s median household income is one of the state’s highest, yet over 17 percent of the county’s children are growing up poor. Childhood poverty is linked to a host of long-term educational, financial, social and health challenges. (14) Research demonstrates that access to affordable housing can improve educational and health outcomes for low-income children. (15) Affordable housing, particularly homeownership, is therefore critical to reducing intergenerational poverty. Homeownership is also one of the few wealth-building opportunities available to low- and moderate-income households.
High housing costs also deprive Santa Fe merchants of revenue. People shop and pay taxes where they live. Enabling more people who work in Santa Fe to obtain housing in Santa Fe will increase the amount they spend in the local economy and increase tax revenue to local governments.
Measuring Affordability
The affordability of housing is typically measured by the housing expense ratio – the ratio of annual housing expenses to total annual household income. Households with housing expense ratios of 30 percent or more, meaning they spend at least 30 percent of income on housing, are considered “housing cost burdened,” while those that spend more than 50 percent of income on housing are considered “severely cost burdened.”
Thirty-two percent of Santa Fe households (roughly 19,100 households) are cost burdened and 15 percent are severely cost burdened (Figure 2).

Figure 2: Santa Fe Households: Housing Cost Burden
Sources: American Community Survey 2019 5-year public use microdata
Housing in Santa Fe
Santa Fe’s affordable housing crisis is mitigated, to some degree, by a relatively high rate of homeownership. Seventy-one percent of the county’s 62,000 households own their home. Homeownership tends to reduce housing cost burden, even among low-income households, because fixed-rate mortgages stabilize housing costs and grow much more slowly than market rents. As Figure 2 makes evident, homeowners in Santa Fe are much more likely than renters to enjoy low or moderate housing cost burden and much less likely to experience high housing cost burden.


Figure 3: Santa Fe Housing Cost Burden by Tenure
Sources: American Community Survey 2019 5-year public use microdata
While some of the difference in cost burden between owners and renters is due to the fact that homeowners tend to have higher incomes than renters, the relationship between homeownership and lower cost burden persists even when the analysis is limited to the county’s 23,100 low-income (16) households (Figure 4).

Figure 4: Cost Burden by Tenure for Low-Income Santa Fe Households
Source: American Community Survey 2019 5-Yr public use microdata
Who are Santa Fe’s Cost Burdened Renters?
In Santa Fe, 7,600 renter households comprised of roughly 15,043 individuals expend more than 30 percent of income on housing. The majority of Santa Fe’s cost-burdened renters (85%) are working age adults, children, and youth (Figure 5). Over two-thirds (68%) of working-age adults in cost-burdened renter households are in the labor force.
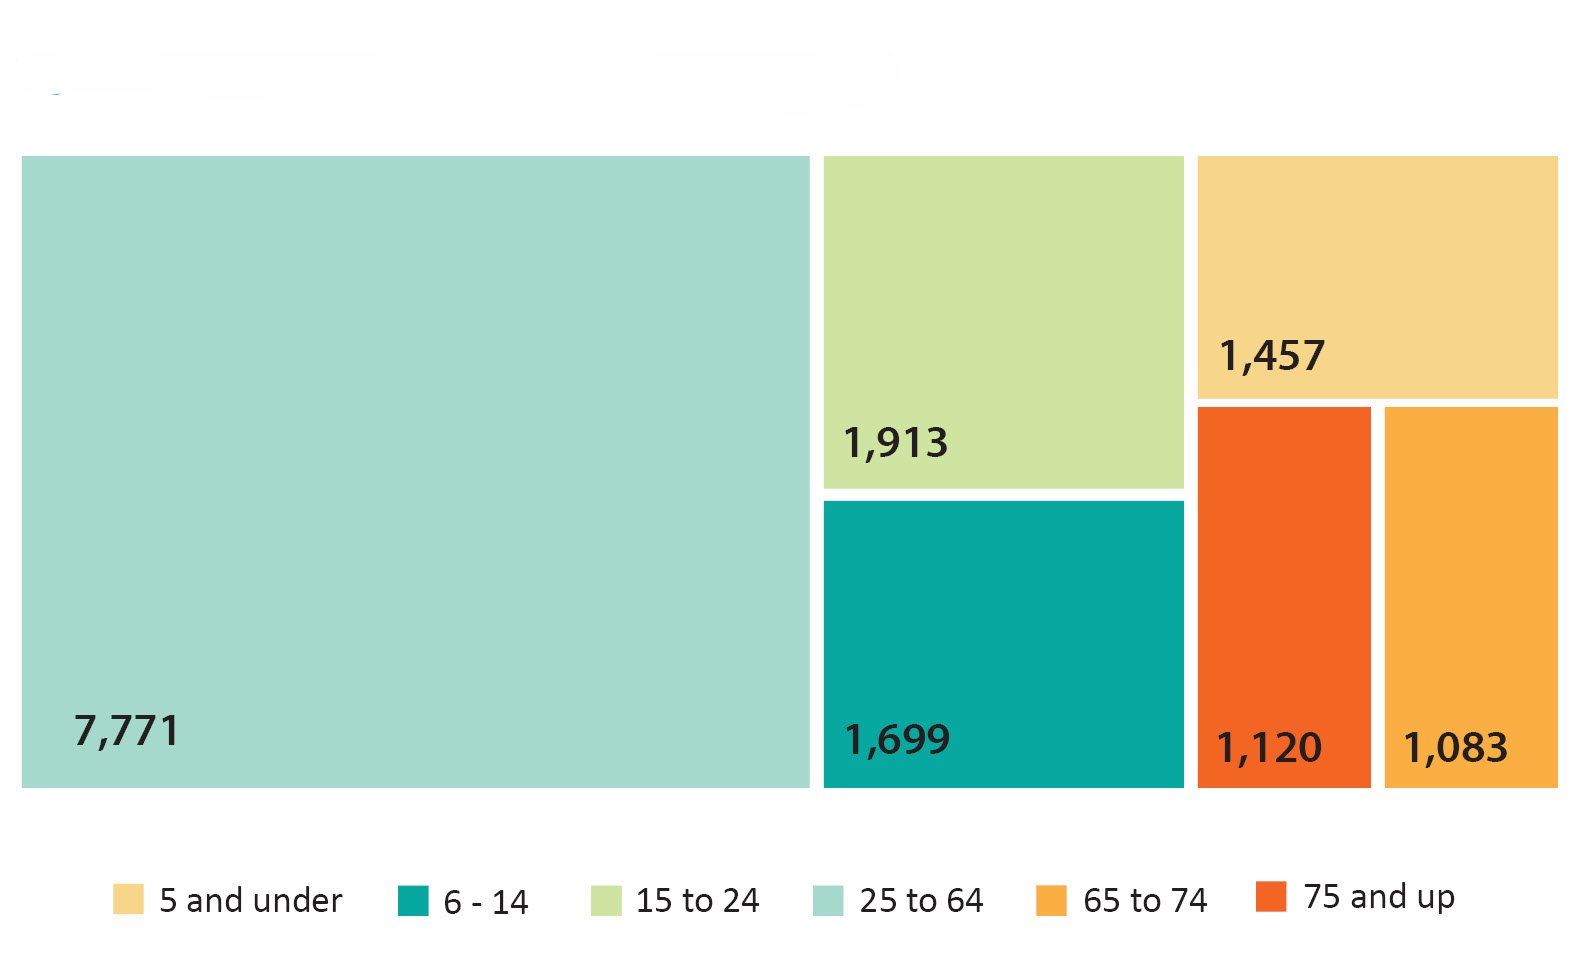
Figure 5:
Santa Fe Cost Burdened Renters by Age
High housing cost burden is associated with poverty; but many households that are cost-burdened are not poor. In fact, over 65 percent of cost-burdened Santa Fe renters (about 9,700 individuals in 5,150 households) have income above the poverty threshold. Figure 6 shows cost-burdened renters by household income as a percent of the federal poverty level (FPL). These data suggest that a significant percentage of cost-burdened renters are candidates for homeownership.

Figure 6:
Cost-Burdened Santa Fe Renters by Poverty Status
Conclusion
Santa Fe’s lack of affordable housing has serious implications for the city’s long term economic growth, diversity, and overall quality of life. Increasing access to affordable housing is therefore key to Santa Fe’s future.
Santa Fe’s affordability crisis is often framed as a deficit of affordable rental units. Focusing so intensely on rental housing as the solution to affordability ignores the fact that many cost burdened Santa Fe area renters could actually afford to buy a reasonably priced home, were such a home available to them. Moving more low- and moderate-income households into homes they own has the added advantage of increasing the supply of available rental housing.
Facilitating such purchases would benefit the entire community by providing both sustainably affordable housing and much-needed wealth building opportunity for the county’s modest-income households.
Notes
2 US Census Bureau. (2021) Longitudinal Employer-Household Dynamics. Retrieved from: https://onthemap.ces.census.gov and Santa Fe Housing Action. (2020, September 10). Impact of Affordable Housing on Families and Communities Part One. Retrieved from: https://santafehousingaction.org/wp-content/uploads/2021/01/AFFORDABLE-HOUSING-FAMILIESCOMMUNITIES-CDWhitePaper9.9.2020LMD-1.pdf
3 New Mexico MFA. (2021). 2020 New Mexico housing needs Assessment. P. 87. Retrieved from: https://housingnm.org/uploads/documents/Final_Version_2020_NM_HNA.pdf
4 Reagan, S. (2020, July). Santa Fe Housing Data. University of New Mexico Bureau of Business and Economic Research. Table 8. P.86. Retrieved from: https://bber.unm.edu/media/publications/SantaFeCountyHousing2020Finalf.pdf
5 Reagan, S. (2020, July). Santa Fe Housing Data. University of New Mexico Bureau of Business and Economic Research. Figure 87. P.91. Retrieved from: https://bber.unm.edu/media/publications/SantaFeCountyHousing2020Finalf.pdf
6 Santa Fe Association of Realtors. Santa Fe Quarterly Property Statistics Q2 2021. Retrieved from: https://sfar.com/wp-content/uploads/2021/07/SFAR_QOS_2021-Q2-1.pdf
8 The inventory of homes for sale declined from 3.3 to 1.4 months of supply. A six-month supply is considered an inventory indicative of market equilibrium.
9 Santa Fe Association of Realtors. Santa Fe Quarterly Property Statistics Q2 2021. Retrieved from: https://sfar.com/wp-content/uploads/2021/07/SFAR_QOS_2021-Q2-1.pdf
10 An affordability index of 49 percent means that Santa Fe median income is only 49 percent of what it would need to be in order to afford a median-priced home. The decline of 17 percentage points from 66 percent to 49 percent in just one year demonstrates how dramatically and quickly home affordability has declined in Santa Fe.
11 United States Bureau of Labor Statistics. Quarterly Census of Employment and Wages. Retrieved from: https://data.bls.gov/maps/cew/us
12 New Mexico Legislative Finance Committee. (2021, April). State Population Trends. Retrieved from: https://www.nmlegis.gov/Entity/LFC/Documents/Program_Evaluation_Reports/Policy%20Spotlight%20-%20State%20Population%20Trends.pdf
13 Hauer, M. E. 2019. Population Projections for U.S. Counties by Age, Sex, and Race Controlled to Shared Socioeconomic Pathway. Scientific Data 6: 190005.https://doi.org/10.1038/sdata.2019.5. Georeferenced U.S. County-Level Population Projections, Total and by Sex, Race and Age, Based on the SSPs, v1 (2020 – 2100). Retrieved from: https://sedac.ciesin.columbia.edu/data/set/popdynamics-us-county-level-pop-projections-sex-race-age-ssp-2020-2100
14 National Academies of Sciences, Engineering, and Medicine; Division of Behavioral and Social Sciences and Education; Committee on National Statistics; Board on Children, Youth, and Families; Committee on Building an Agenda to Reduce the Number of Children in Poverty by Half in 10 Years; Le Menestrel S, Duncan G, editors. A Roadmap to Reducing Child Poverty. Washington (DC): National Academies Press (US); 2019 Feb 28. 3, Consequences of Child Poverty. Available from: https://www.ncbi.nlm.nih.gov/books/NBK547371/
15 Sandel M., Sheward R., Ettinger de Cuba, S., et al. (2018) Unstable Housing and Caregiver and Child Health in Renter Families. Pediatrics. 141(2):e20172199 and Katherine A. Ahrens, Barbara A. Haley, Lauren M. Rossen, Patricia C. Lloyd, Yutaka Aoki, “Housing Assistance and Blood Lead Levels: Children in the United States, 2005–2012”, American Journal of Public Health 106, no. 11 (November 1, 2016): pp. 2049-2056 and Raj Chetty & Nathaniel Hendren & Lawrence F. Katz, 2016. "The Effects of Exposure to Better Neighborhoods on Children: New Evidence from the Moving to Opportunity Experiment," American Economic Review, American Economic Association, vol. 106(4), pages 855-902, April.
16 For purposes of this analysis, the term “low income” is defined as income below 80 percent of the area median income (AMI). Area median income is published annually by HUD. For 2022, 80% of AMI for a family of four is $58,400.