
Housing Justice = Climate Justice
KELLY O’DONNELL, PH.D. | CHIEF RESEARCH AND POLICY OFFICER, HOMEWISE
Overview
Santa Fe’s housing crisis is contributing to climate change. Nearly two in every five jobs located in Santa Fe are held by people who live outside the county. Seventy-eight percent of workers who commute into Santa Fe travel alone and by car.
Under the leadership of Governor Lujan Grisham, New Mexico has established ambitious climate goals that include a 45 percent reduction in CO2 equivalent from 2005 levels by 2030. (1) The City of Santa Fe’s equally ambitious goals, as presented in the Sustainable Santa Fe 25-Year Plan, include carbon neutrality by 2040. (2) Both the New Mexico Climate Strategy and the Sustainable Santa Fe Plan include reducing the distance traveled in single-occupant motor vehicles as strategies for achieving climate goals.
Transportation is the single largest source of greenhouse gas emissions in the U.S. and passenger vehicles are the largest single source of emissions within the transportation sector. Although remote work, increased utilization of ridesharing, public transportation, and more fuel-efficient vehicles can help reduce commuting’s carbon footprint, decreasing the number of miles New Mexicans drive remains critical to reducing emissions and combatting climate change. Making it possible for more people to live in close proximity to work, shopping, services, and school is key to reducing New Mexicans’ automobile dependence.
Although people commute for a variety of reasons, access to affordable housing is a major consideration for many. According to Zillow, in December 2021, the median value of a single-family home in Santa Fe hit $628,000, over twice the $301,000 median price in Albuquerque. Commuting between the two cities costs the typical solo commuter over $10,000 a year in vehicle-related expenses alone, but this is still less than the premium they would pay to own a mid-priced Santa Fe home.
Housing justice and climate justice are inextricably linked. National research shows that due to rapidly escalating housing costs in job-rich areas, the burden of living far from the workplace is increasingly borne by lower-income workers and people of color. Equity demands that manageable commutes and walkable neighborhoods be available to all workers, not just those who can afford to live near downtown Santa Fe.
Workers who commute to work in Santa Fe from outside the county generate 317,780 metric tons of CO2 equivalent (CO2e) – between 10 and 21 percent of the county’s total GHG emissions – each year. Moving to Santa Fe would reduce their carbon footprint by 92 percent or 16.3 mt CO2e per commuter.
To reduce the carbon footprint of its employment base, Santa Fe must increase the supply of homes that are affordable to working families and close to jobs, amenities, and transit. This means increasing the density of housing through infill development — building on vacant parcels within existing municipal boundaries.
Greenfield development – building new homes on inexpensive virgin land at the urban fringe – is a cheap way to produce housing that has grown the housing stock in places like west Albuquerque, but the costs that sprawl development impose on households and the environment are not sustainable. Not only does such development increase car dependence and the number vehicle miles residents must travel, it also depletes the state’s carbon sinks — reserves of undeveloped land that help to reduce atmospheric carbon by absorbing more carbon than they produce.
Santa Fe and the State of New Mexico have established ambitious climate goals. Done right, housing development can play an important role in meeting those goals by increasing access to public transportation and reducing the distances that residents must drive to work. Land use planning that prioritizes infill development and discourages urban sprawl will enable Santa Fe to meet both its climate goals and its need for affordable housing.
High Housing Costs and the Long Journey to Work
Due to a profound shortage of affordable housing, many people who work in Santa Fe can’t afford to live there. In fact, over one-third of the people employed in Santa Fe commute in from surrounding counties, most by car. (3)
In 2019, 62,537 people were employed in Santa Fe County. (4) Almost 23,000 or 37 percent of these workers lived outside the county. Ninety-two percent of commuters into Santa Fe traveled by car and 78 percent traveled alone by car (Table 1). (5)

Table 1: Santa Fe In-Commuters by Means of Transportation to Work
Source: 2019 5-Yr American Community Survey Public Use Microsample
People commute into Santa Fe from all over New Mexico, although residents of Bernalillo and Sandoval Counties make up roughly half (48%) of Santa Fe’s in-commuters. Residents of Rio Arriba and San Miguel counties account for another 15 percent of commuters into Santa Fe (Figure 1).

Figure 1:
Santa Fe In-Commuters by Location of Residence
Each year, workers travel over 1.1 billion miles to and from jobs in Santa Fe. The 37 percent of workers who commute from outside the county account for 91 percent of these miles or roughly 1 billion vehicle miles annually (Table 2).


Workers who commute into Santa Fe by car spend an average of 46 minutes on the road each way or just over 90 minutes round trip. (6) These long commutes are costly to workers, their families, and the environment.
For Some Workers, Long Commutes are the Price of Affordable Housing
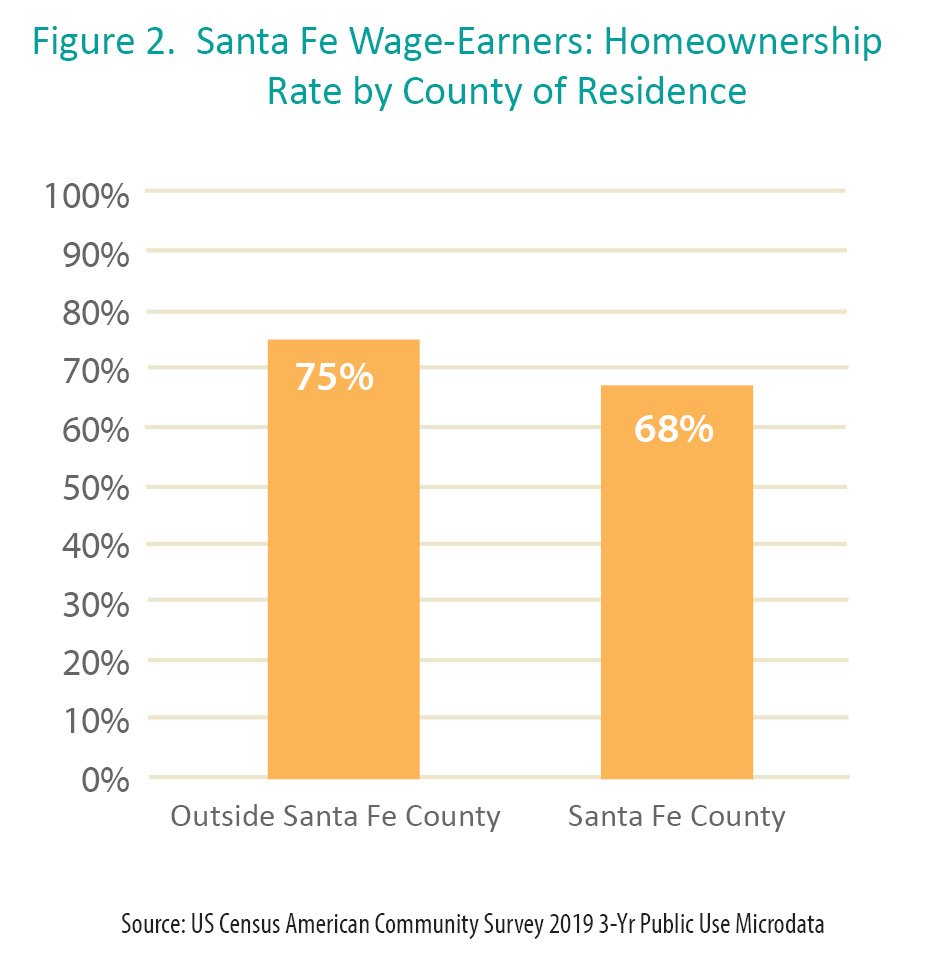
Although people commute for a variety of reasons, access to affordable housing is a major consideration for many wage earners who live far from where they work. (7) Santa Fe’s in-commuters are significantly more likely than people who both live and work in Santa Fe to own the home they live in (8) (Figure 2). In-commuters also fair better than workers who live in Santa Fe on a key measure of affordability – housing expense ratio – which measures monthly housing expenses as a percentage of household income. Workers who commute into Santa Fe from other counties have an average housing expense ratio of .19, meaning that they devote an average of 19 percent of their income to housing-related expenses, while people who live and work in Santa Fe have an average housing expense ratio of .23. (9)

In December 2021, the median value (10) for a single-family home in Santa Fe was $628,000, over twice the median price in Albuquerque ($301,000) and substantially higher than median prices in Rio Rancho ($350,000) and Española ($230,000). (11)
Figure 3 shows median home values by year for Santa Fe and the four cities where the majority of Santa Fe’s in-commuters live.

Figure 3
Source: Zillow Home Value Index. Retrieved from: zillow.com
Not only are Santa Fe’s housing costs increasing faster than those of neighboring cities, they are growing much faster than wages. Between June 2020 and June 2021, the median price of a single family home in Santa Fe increased 30 percent12 while wages grew 2.7 percent.13 A growing body of research finds that the long commutes endured by increasing numbers of American workers are due, in large part, to a profound scarcity of affordable housing near employment centers. (14, 15, 16, 17, 18, 19)
Spending hours on the road between work and home imposes high costs on workers, their families, employers, and the environment. In 2021, road congestion cost New Mexico drivers an estimated $845 million in lost time and wasted fuel. (20) Commuting from Albuquerque to Santa Fe five days a week 50 weeks per year costs over $10,000 in vehicle-related costs alone. (21) This is a lot of money, but still less than the $15,000 average difference in annual housing-related costs (mortgage payments, property taxes, and homeowners insurance) for the median priced home in the two cities. (22)
Long commutes have also been shown to negatively impact commuters’ health and well-being. (23, 24, 25) There is also evidence that long trips to and from work reduce worker productivity and contribute to absenteeism and employee turnover. (26) Nationally, the increasing disparity between wages and the cost of housing may also be reducing overall economic productivity by limiting the ability of workers to migrate to areas with lots of jobs and wage growth. (27)
The Burden of Commuting is Increasingly Borne by Frontline Workers and Workers of Color
A 2022 study of the impact of housing costs on commuting in Los Angeles found that wealthier households had shorter commutes and that the burden of long commutes was borne disproportionately by households of color. (28)
Disparities in access to remote work increase the relative burden commuting places on front-line workers, lower wage workers, younger workers, and workers of color. A 2019 study by the US Bureau of Labor Statistics found that, in the US:
Workers in the leisure and hospitality sectors were less likely than workers in any other sector to be able to work remotely.
Hispanic wage and salary workers were less than half as likely as non-Hispanic workers to be able to work remotely (13 percent versus 27 percent).
Higher-wage workers were six times as likely to be able to work from home as lower-wage workers. (29)
Workers age 35 to 44 were over six times more likely to have access to remote work than workers under age 25 (32 percent versus 5 percent). (30)


Transportation and Climate Change
In Santa Fe and nationally, transportation is the single largest source of greenhouse gas emissions and passenger vehicles are the largest single source of emissions within the transportation sector. (31, 32) In New Mexico, transportation is second only to the state’s oil and gas industry as a source of GHG emissions. (33) Although remote work, increased utilization of ridesharing, and more fuel-efficient or fully-electric vehicles can help decrease automobile emissions, reducing New Mexicans’ automobile dependence is critical to attaining climate goals. Higher density housing within urban areas reduces automobile dependence by putting homes in closer proximity to destinations like work and school. Greater densities also increase the financial viability of public transportation by boosting ridership. (34)
According to the US Environmental Protection Agency (EPA), the typical passenger vehicle emits about 404 grams of CO2 per mile or about 4.6 metric tons of carbon dioxide per year. (35, 36) Thus, it is hardly surprising that a study by Sun Microsystems found that the daily commute to and from work accounted for more than 98 percent of their employees’ work-related carbon footprint. (37)
Under the leadership of Governor Lujan Grisham, New Mexico has established ambitious climate goals that include a 45 percent reduction in CO2 equivalent from 2005 levels by 2030. (38) The City of Santa Fe’s equally ambitious goals, as presented in the Sustainable Santa Fe 25-Year Plan, include carbon neutrality by 2040. (39) Both the New Mexico Climate Strategy and the Sustainable Santa Fe Plan include reducing the distance traveled in single-occupant motor vehicles as strategies for achieving climate goals.
Reducing the Community’s Carbon Footprint
An individual’s ‘carbon footprint’ is the amount of greenhouse gas they produce expressed in units of carbon dioxide (CO2 equivalents or CO2e). According to the most recent data available from the US Energy Information Administration (EIA), New Mexicans produced 21.7 metric tons (40) of CO2e per capita in 2018. (41) By this metric, Santa Fe County’s 150,358 residents have a combined annual carbon footprint of 3.3 million mt CO2e. The City of Santa Fe’s own analysis of GHG emissions concluded that per capita emissions in Santa Fe averaged 10 mt CO2e, much less than the statewide average due to the fact that most of the state’s high-emission activities (other than transportation) such as oil and gas development and coal-fired electricity generation occur outside of Santa Fe. (42) Using the City’s estimate of per-capita GHG emissions, county residents have a combined carbon footprint of 1.5 million mt CO2e.
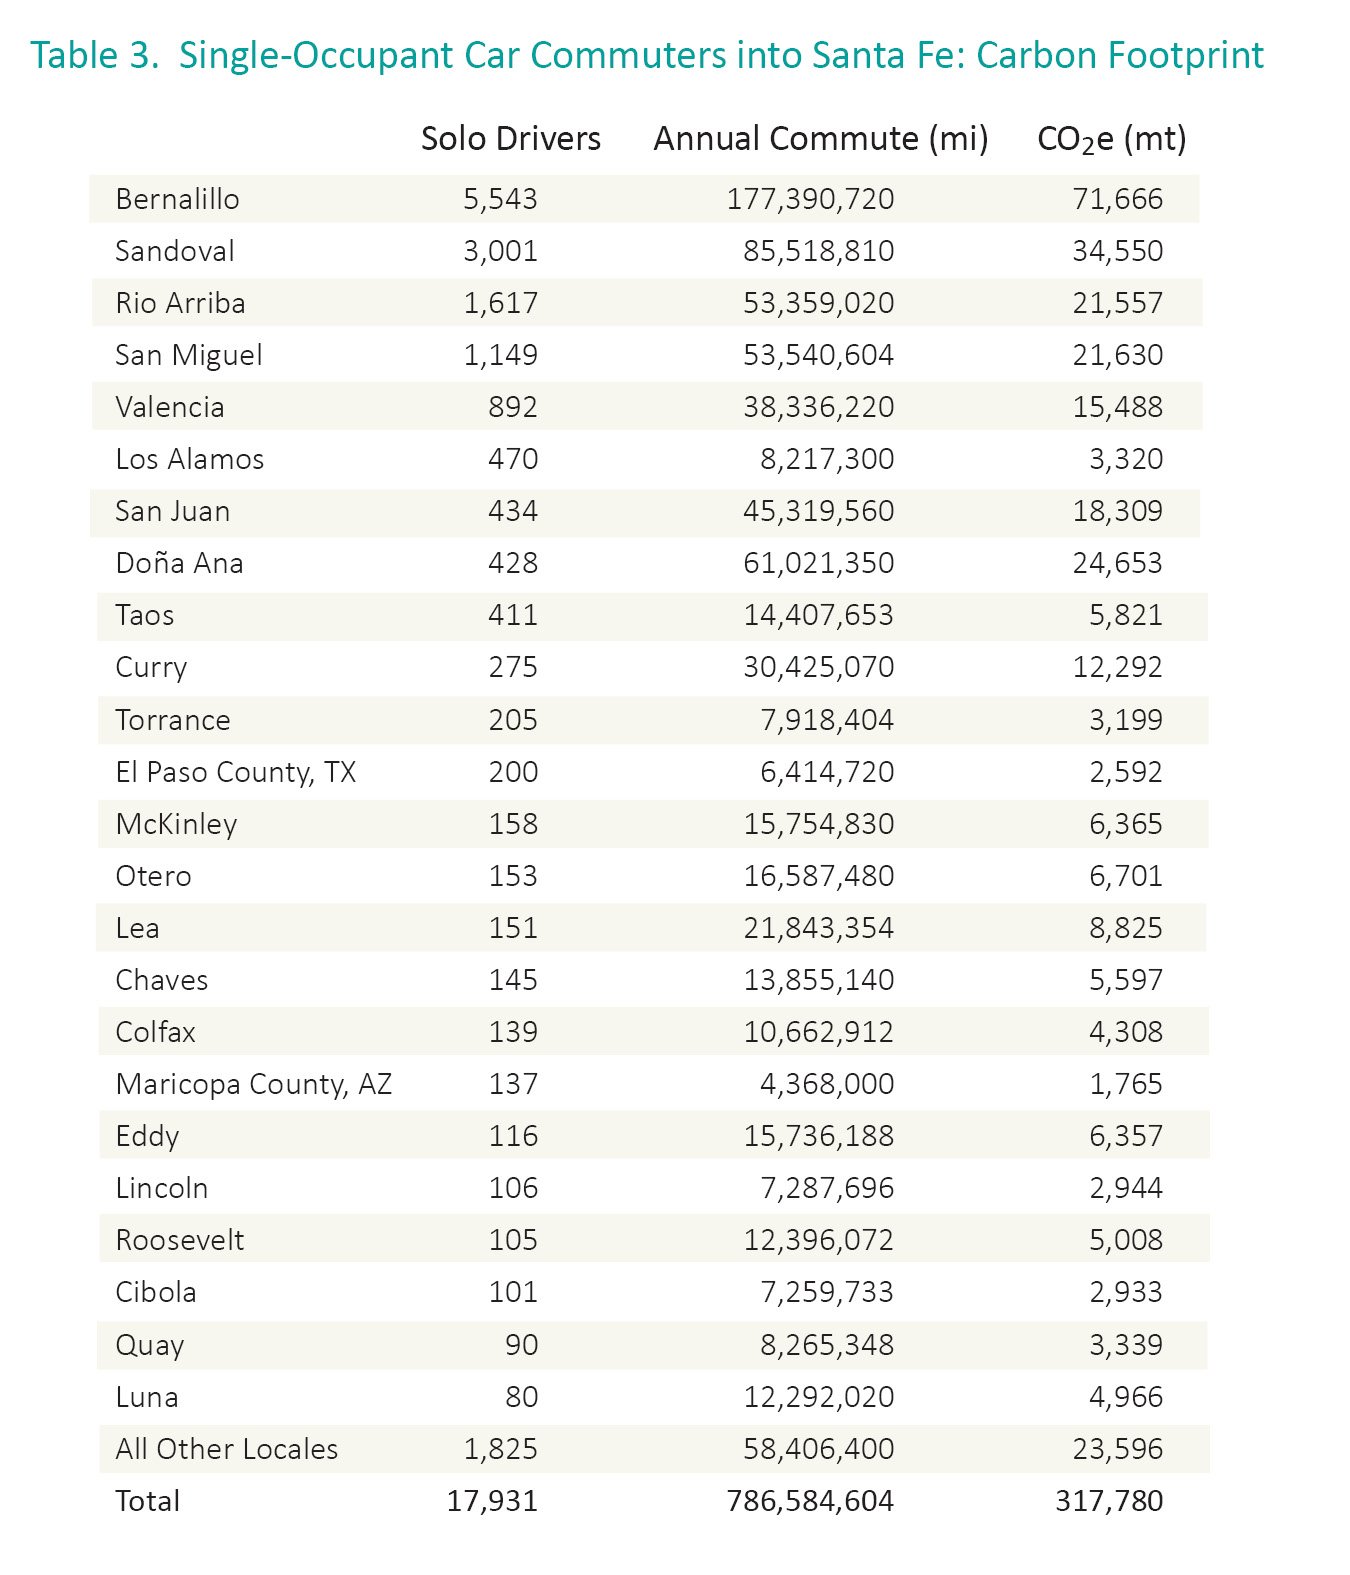
Workers from outside Santa Fe who drive alone to jobs in Santa Fe generate over 317,780 metric tons (701 million lbs.) of CO2e annually or 17.7 mt per capita during their commute (Table 3). This equates to 21 percent of total emissions as calculated by the City, or 10 percent of total emissions using statewide GHG emission averages.
Living in Santa Fe greatly reduces, but does not eliminate, a commuter’s carbon footprint. Ninety-two percent of workers who both live and work in Santa Fe commute by car and, similar to in-commuters, 78 percent drive alone. The trip to work for in-town car commuters averages 18 minutes and roughly seven miles each way. Assuming a 14 mile round trip, Santa Fe’s in-town solo car commuters each produce an annual average of 1.4 mt CO2e traveling to and from work. Workers who commute to work in Santa Fe from outside the county would reduce the carbon footprint of their commute by 92 percent or 16.3 mt CO2e by moving to Santa Fe.

Infill Development Combats Climate Change
Making it possible for more people who work in Santa Fe to live in Santa Fe is key to meeting the community’s climate goals. This means increasing the supply of workforce housing through a multipronged approach that includes increasing accessory dwelling units (ADUs), preserving the current supply of affordable rentals, developing new affordable rental units, and, most importantly, developing more homes that Santa Fe workers can afford to buy.
It is not enough, however, to simply build more homes. Homebuilding has its own carbon footprint which must also be minimized. Infill development – building on land within existing municipal boundaries – has been recognized as critical to both housing equity and climate justice. It stands in stark contrast to greenfield or sprawl development – which utilizes previously undeveloped land at the urban fringes – and increases GHG emissions by increasing car dependence (43) as well as the emissions from delivering public services like water, sewer, waste collection and public safety.
Sprawl development also contributes to climate change by destroying greenfield land, which provides essential environmental services, including wildlife habitat, flood mitigation, and the net absorption of CO2. (44)
Assessing the role new housing production could play in helping to meet California’s proposed 2030 greenhouse gas reduction goals, scholars at UC Berkeley concluded that the state could meet its longterm economic and environmental objectives by “building the right type of housing in the right places;” by which they meant “homes that allow for reduced driving, as well as less energy and water usage, with compact development near transit, goods, and services.” The same study found that when compared to ‘business as usual’ options, infill-focused development scenarios produced the best climate outcomes while also maximizing economic benefits for households by cutting construction costs, lowering utility bills, and reducing daily travel by an average of 18 vehicle miles per day. (45)
A 2020 report by the United Nations’ International Resource Panel found that cities could reduce emissions by between 30 and 55 percent by rejecting sprawl and instead adopting approaches to metropolitan development that emphasize energy efficiency and prioritize people over cars by placing new housing near existing jobs and amenities. (46)
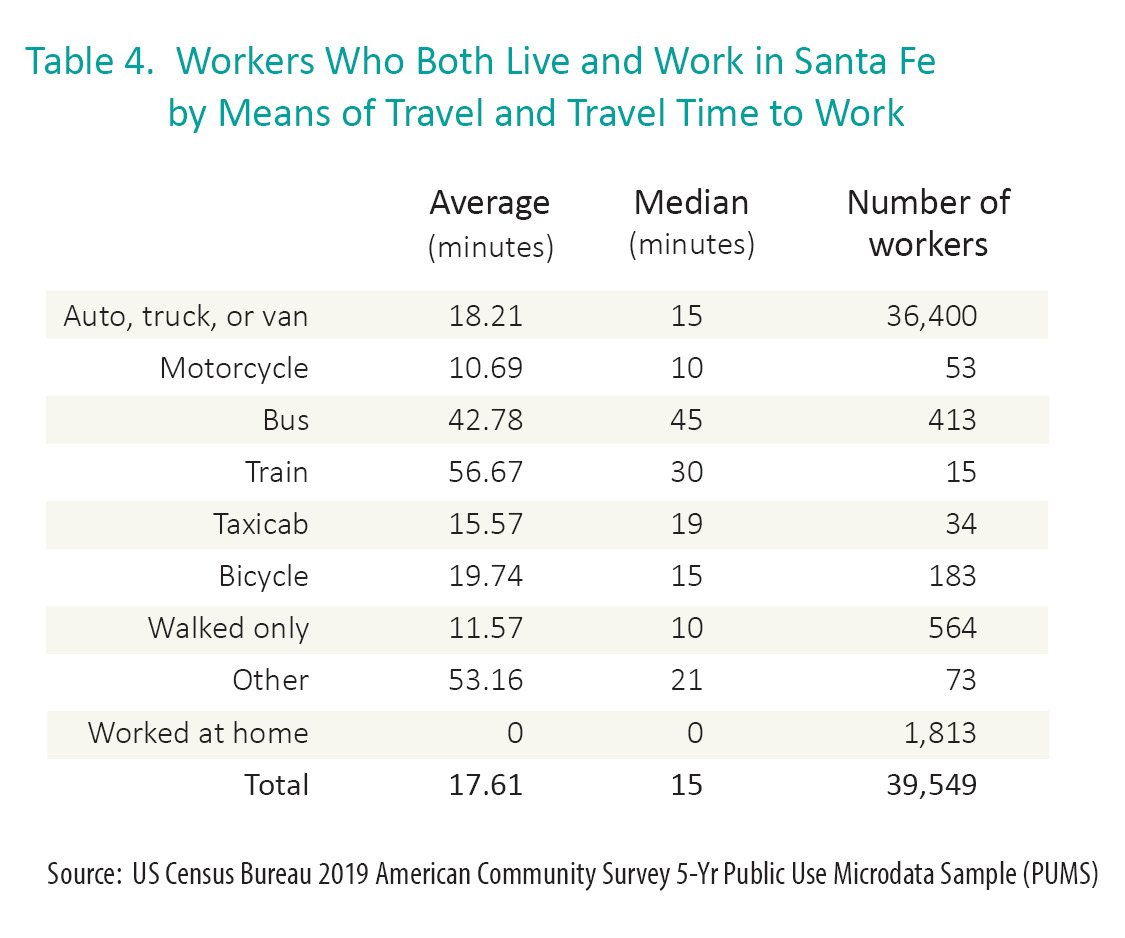
By enabling people to live closer to work, shopping, school and public transportation; higher-density urban development provides an antidote to sprawl that can also help reduce the carbon footprint of people who already both live and work in Santa Fe. Table 4 shows average and median one-way travel times by means of transportation to work for wage-earners who both live and work in Santa Fe. Roughly 1 percent of Santa Fe wage-earners use public transportation to get to work. Increased utilization of public transportation could significantly reduce cityside emissions; but if ridership is to increase, Santa Fe’s public transportation system has to become more accessible and convenient. Improvements like better coordination with other transit systems, more routes, more stops, and extended schedules would increase the number of Santa Fe residents who are willing and able to rely on public transportation to get around town, but the cost-effectiveness of such enhancements relies on higher population densities. The viability of walking, bicycling, and other forms of zero-emissions transport is also density dependent. (47)

The privilege of living close to work and school should not be reserved for the well-to-do. Although we cannot undo decades of sprawl development in places like Albuquerque, we can take steps to ensure that new housing developments are in close proximity to existing jobs. The term existing is important here because promising to ‘create’ jobs by attracting businesses to planned residential developments has become part of the greenfield developers’ playbook when seeking public subsidies for auto-dependent subdivisions. (48)
Conclusion
Climate change is an existential threat. To avoid its most extreme impacts we must all change aspects of how we live and work. Nationally, rapid growth in the price of housing relative to incomes has forced many low- and moderate-income workers to travel ever-greater distances from their workplaces to obtain housing they can afford. New Mexico is no different. Generations of state employees and other Santa Fe workers have accepted hours-long daily commutes as the price of homeownership. However, as fires, floods, and declining instream flows have made abundantly clear, the costs borne by commuters are only a fraction of the price we are all paying for our heedless consumption of fossil fuels. Santa Fe has established ambitious climate goals that cannot be met without increasing the profound under-supply of workforce housing and prioritizing infill development. Greenfield development – building on previously undisturbed land outside municipal boundaries – will take us in the wrong direction by increasing our toxic dependence on cars.
Notes
1 New Mexico Executive Order 2019-003 on Climate Change and Waste Prevention. Retrieved from: https://www.governor.state.nm.us/wp-content/uploads/2019/01/EO_2019-003.pdf
2 Sustainable Santa Fe Commission. (2018, October) Sustainable Santa Fe 25-Year Plan Retrieved from: www.santafenm.gov/media/files/Sustainable_SF_Commission/Sustainable%20Santa%20Fe_October_Printsm.pdf
3 U.S. Census Bureau. (2022). LEHD Origin-Destination Employment Statistics Data (2002-2019). Washington, DC: U.S. Census Bureau, Longitudinal-Employer Household Dynamics Program. Retrieved from: https://lehd.ces.census.gov/data/#lodes
4 The number of people employed in Santa Fe is a subset of the number who work in Santa Fe because employment numbers do not include the self-employed, military members, and other workers whose employment is not reported for purposes of Unemployment Insurance.
5 Means of travel percentages are derived from US Census 2019 1-yr American Community Survey Table S0804 ‘Means Of Transportation To Work By Selected Characteristics For Workplace Geography.’ Retrieved from: https://data.census.gov
6 US Census 2019 1-yr American Community Survey Table S0804. Means Of Transportation To Work By Selected Characteristics For Workplace Geography. Retrieved from: https://data.census.gov
8 Odds Ratio = 1.45 (1.4, 1.5) X2(4)=550.7 p<.0001
9 American Community Survey 2019 3-year microdata
10 Zillow Home Value Index (ZHVI) for single family homes in December 2021. Retrieved from: https://www.zillow.com. ZHVI is a smoothed, seasonally adjusted measure of the typical home value for a given region and housing type. It reflects the typical value for homes in the 35th to 65th percentile range (Median = 50th percentile).
11 Includes homes in the City of Santa Fe and Santa Fe County. Source: Zillow Home Value Index. Retrieved from: https://www.zillow.com
12 Santa Fe Association of Realtors. Santa Fe Quarterly Property Statistics Q2 2021. Retrieved from: https://sfar.com/wp-content/uploads/2021/07/SFAR_QOS_2021-Q2-1.pdf
13 United States Bureau of Labor Statistics. Quarterly Census of Employment and Wages. Retrieved from: https://data.bls.gov/maps/cew/us
14 Sisson, P. (2017, 20 June). Supercommuters, skyrocketing commutes, and America’s affordable housing crisis. Curbed. Retrieved from: https://archive.curbed.com/2017/6/20/15834514/rent-transportation-commute-affordable-housing
15 Kneebone, E. and Holmes, N. (2016). The growing distance between people and jobs in metropolitan America. Brookings Institution. Retrieved from: https://www.brookings.edu/wp-content/uploads/2016/07/Srvy_JobsProximity.pdf
16 Schuetz, J. (2019, 7 May). Cost, crowding, or commuting? Housing stress on the middle class. Brookings Institution. Retrieved from: https://www.brookings.edu/research/cost-crowding-or-commuting-housing-stress-on-the-middle-class/
17 Blumenberg, E. & King, H. (2021) Jobs–housing balance re-re-visited J. Am. Plan. Assoc., 87 (2021), pp. 484-496, 10.1080/01944363.2021.1880961. Retrieved from: https://www.tandfonline.com/doi/abs/10.1080/01944363.2021.1880961?journalCode=rjpa20
18 S. Sultana. (2002). Job/housing imbalance and commuting time in the Atlanta metropolitan area: exploration of causes of longer commuting time. Urban Geogr., 23 pp. 728-749. Retrieved from: https://www.tandfonline.com/doi/abs/10.2747/0272-3638.23.8.728
19 Ganong, P. & Shoag, D.W. (2017). Why Has Regional Income Convergence In The U.S. Declined? Working Paper 23609. Nation Bureau of Economic Research. Retrieved from: http://www.nber.org/papers/w23609
20 TRIP (2022). New Mexico Transportation By The Numbers Meeting The State’s Need For Safe, Smooth And Efficient Mobility Retrieved: https://tripnet.org/wp-content/uploads/2022/01/TRIP_New_Mexico_Transportation_by_the_Numbers_Report_January_2022.pdf
22 Comparison assumes housing costs based 3 percent down payment, 30-yr fixed rate mortgage at 3.2%, taxes, and insurance
23 Choi, J., Coughlin, J.F., & D’Ambrosio, L. (2013). Travel time and subjective well-being. Transp. Res. Rec. J. Transp. Res. Board, 2357. pp. 100-108, 10.3141/2357-12
24 Chatterjee, K., Clark, B., Martin, A., & Davis, A. (2017). The commuting and wellbeing study: Understanding the impact of commuting on people’s lives. Bristol: UWE Bristol. Retrieved from: https://www.travelbehaviour.com/outputs-commuting-wellbeing/
25 Z. Feng, & P. Boyle.(2014). Do long journeys to work have adverse effects on mental health? Environ. Behav., 46 pp. 609-625. Retrieved from: https://journals.sagepub.com/doi/10.1177/0013916512472053
26 Katz, B. & Turner, M.A. (2008) “Rethinking U.S. Rental Housing Policy: A New Blueprint for Federal, State, and Local Action,” in Nicolas P. Retsinas and Eric S. Belsky, eds., Revisiting Rental Housing: Policies, Programs, and Priorities. Washington: Joint Center for Housing Studies and Brookings Institution Press.
27 Ganong, P. & Shoag, D.W. (2017). Why Has Regional Income Convergence In The U.S. Declined? Working Paper 23609. Nation Bureau of Economic Research. Retrieved from: http://www.nber.org/papers/w23609
28 Islam, M.R. & Saphores, J.M.(2022). An L.A. story: The impact of housing costs on commuting. Journal of Transport Geography. V 98. Retrieved from: www.sciencedirect.com/science/article/pii/S0966692321003197
29 61% of workers in the top earnings quartile and 9% of workers in the bottom earnings quartile had access to remote work.
30 US Bureau of Labor Statistics. (24 September, 2019). Job Flexibilities And Work Schedules — 2017-2018 Data From the American Time Use Survey. Retrieved from: https://www.bls.gov/news.release/pdf/flex2.pdf and Gould, E. & Shierholz, H. (2020, 19 March). Not everybody can work from home. Economic Policy Institute. Retrieved from: https://www.epi.org/blog/black-and-hispanic-workers-are-much-less-likely-to-be-able-to-work-from-home/
31 According to the City of Santa Fe, on-road transportation makes up 41 percent of total emissions and is largest source of greenhouse gas emissions in Santa Fe. Retrieved from: https://www.santafenm.gov/santafe_emissions
32 Carbon dioxide (CO2) produced by the combustion of petroleum fuels accounts for about 95 percent of greenhouse gas emissions from transportation. Source: United States Environmental Protection Agency. Sources of Greenhouse Gas Emissions. Retrieved from: https://www.epa.gov/ghgemissions/sources-greenhouse-gas-emissions#transportation
33 New Mexico Interagency Climate Change Task Force. 2020 New Mexico Climate Change Strategy. Retrieved from: https://www.climateaction.nm.gov/wp-content/uploads/2021/06/NMClimateChangeReport_2020.pdf
34 Federal Transportation Administration. (2019, April). Transit Oriented Development. Retrieved from: https://www.transit.dot.gov/TOD
35 This estimate assumes the average gasoline vehicle on the road has a fuel economy of about 22.0 miles per gallon and drives around 11,500 miles per year. See: US Environmental Protection Agency.(2018, March) Greenhouse Gas Emissions from a Typical Passenger Vehicle. Retrieved from: https://www.epa.gov/greenvehicles/greenhouse-gas-emissions-typical-passenger-vehicle
36 In addition to CO2, automobiles produce methane (CH4) and nitrous oxide (N2O) from the tailpipe and hydrofluorocarbon emissions from leaking air conditioners.
37 Green Car Congress (2008). Sun Microsystems Study Finds Open Work Program Reduces Energy Consumption, Saves Time and Money. Retrieved from: https://www.greencarcongress.com
38 New Mexico Executive Order 2019-003 on Climate Change and Waste Prevention. Retrieved from: https://www.governor.state.nm.us/wp-content/uploads/2019/01/EO_2019-003.pdf
39 Sustainable Santa Fe Commission. (2018, October) Sustainable Santa Fe 25-Year Plan Retrieved from: www.santafenm.gov/media/files/Sustainable_SF_Commission/Sustainable%20Santa%20Fe_October_Printsm.pdf
40 Metric ton (mt) = 1000 kg or 2204.6 lbs.
41 US Energy Information Administration.(3 March, 2021) Energy-Related CO2 Emission Data Tables. Retrieved from: https://www.eia.gov/environment/emissions/state/
42 City of Santa Fe Environmental Services Division. Greenhouse Gas Emissions in Santa Fe. Retrieved from: https://www.santafenm.gov/santafe_emissions
43 Rice, J.L., Cohen, J.A., Long, J., & Jurjevich, J.R. (2019). Climate-Friendly City: New Perspectives on Eco-Gentrification and Housing Justice. Retrieved from: https://onlinelibrary.wiley.com/doi/10.1111/1468-2427.12740
44 Van Deren, M., Armistead, C., Kerr, N., Soares, J. (2019). The Costs of Sprawl: The Potential Impacts of Development in Pierce County, Washington. Earth Economics. Tacoma, WA. Retrieved from: https://www.eartheconomics.org/s/TheCostsofSprawl_EarthEconomics_March2019w.pdf
45 Elkind, E. N, Galante, C., Decker, N., Chapple, K., Martin, A., & Hanson, M. (2017). Right Type, Right Place: Assessing the Environmental and Economic Impacts of Infill Residential Development through 2030. UC Berkeley: Berkeley Law. Retrieved from https://escholarship.org/uc/item/9fk087g3
46 Swilling, M., Hajer, M., Baynes, T., Bergesen, J., Labbé, F., Musango, J.K., Ramaswami, A., Robinson, B., Salat, S., Suh, S., Currie, P., Fang, A., Hanson, A. Kruit, K., Reiner, M., Smit, S., & Tabory, S. (2018). The Weight of Cities: Resource Requirements of Future Urbanization. A Report by the International Resource Panel. United Nations Environment Programme, Nairobi, Kenya. Retrieved from: https://www.resourcepanel.org/reports/weight-cities
47 Spieler, C. (2018)Trains, Buses, People An Opinionated Atlas of US Transit. Washington, DC : Island Press
48 Shanske, D. & Niemeier, D. (2021). Subsidizing Sprawl, Segregation, and Regressivity: A Deep Dive into Sublocal Tax Districts. Iowa Law Review. 106 (2427). Retrieved from: https://ilr.law.uiowa.edu/print/volume-106-issue-5/subsidizing-sprawl-segregation-and-regressivity-a-deep-dive-into-sublocal-tax-districts/